Difference between geoJson and topoJson. But
not necessary thanks to leaflet.
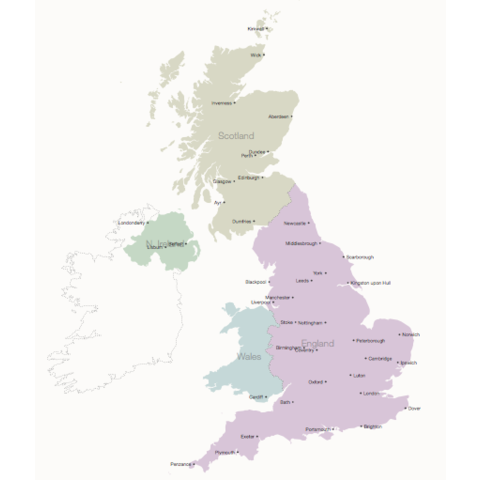
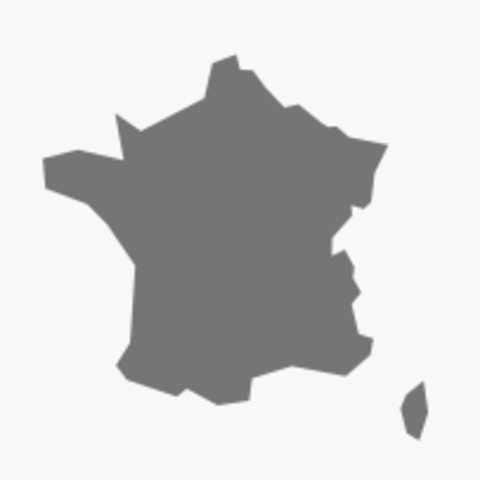
geoJson file
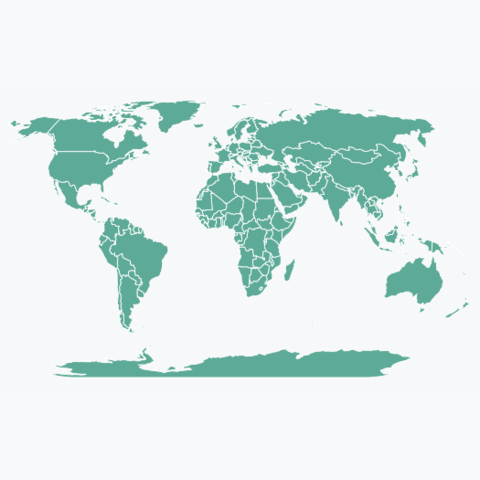
Input data for maps is geoJson format. D3.js works very
well to display this kind of information using path.
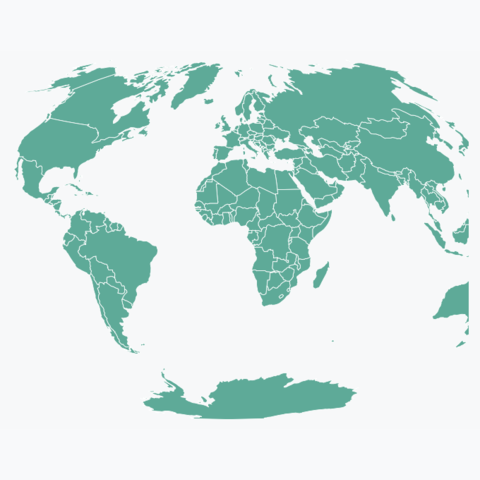
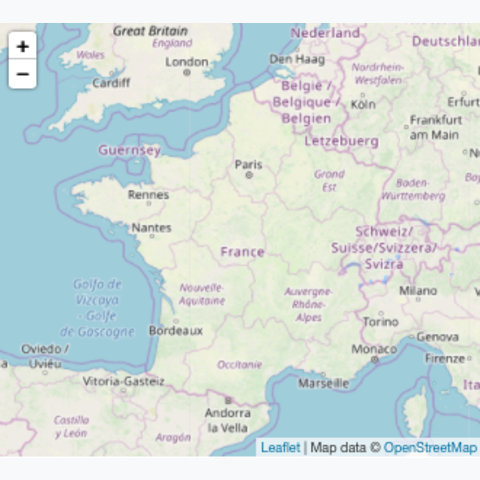
Leaflet.js open source library
Leaflet is an open-source JavaScript library for mobile-friendly interactive maps. Awesome for background maps. See the range of background tiles you can use here and here.
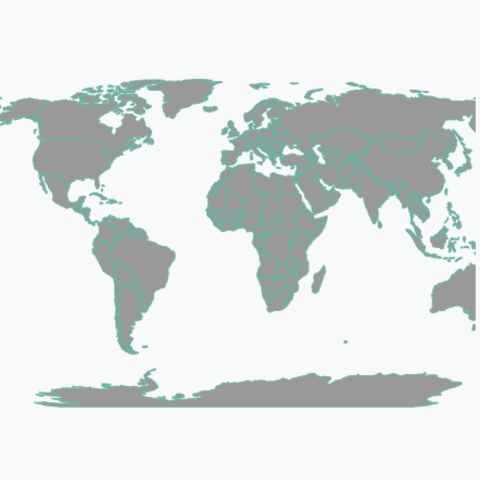
CanvasCanvas is an alternative to SVG. Its main advantage is that it avoids to overload the dom and thus often leads to better browser performance. Here are examples showing how to build background maps using d3.js and canvas:
A few blocks with more complicated codes to showcase the possibility
of the d3-sankey plugin