Step by step
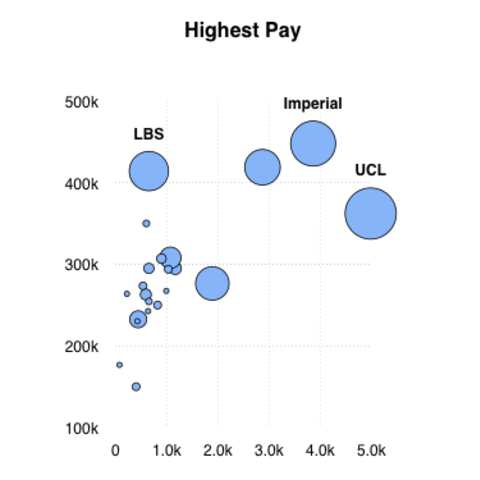
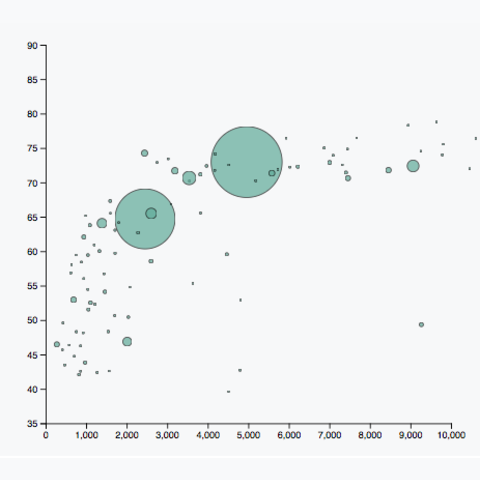
Building a bubble chart basically follows the same process as for a scatterplot, except that another scale is used to map a variable to bubble size. Thus, have a look to the scatterplot section for more examples.
Template
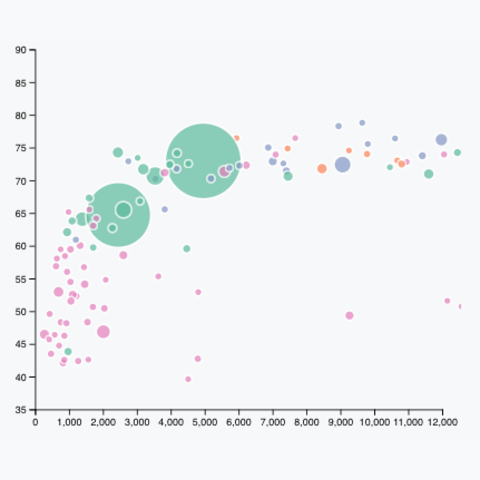
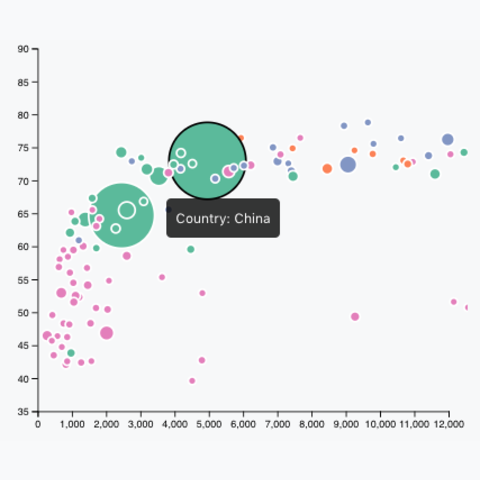
Here is the template I use to start a bubble chart project. Legend describes both size and color. Hover the legend to highlight the corresponding group. Hover a bubble to get country name.
Get codeSelection of blocks
A selection of blocks involving bubble charts