Step by step
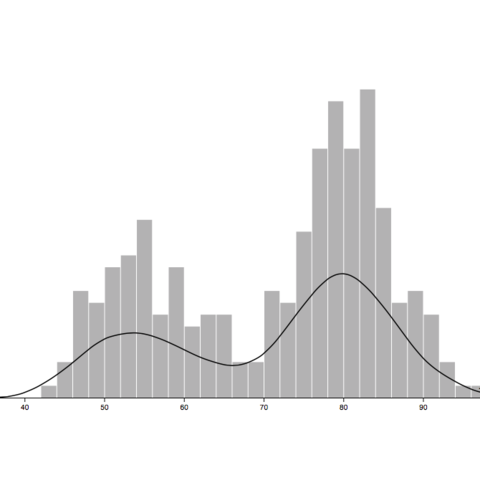
A
density plot
shows the distribution of a numeric variable. In the following
examples, a kernel density estimation is always used. The
result can then be plotted using the d3.line() function.
Interactivity
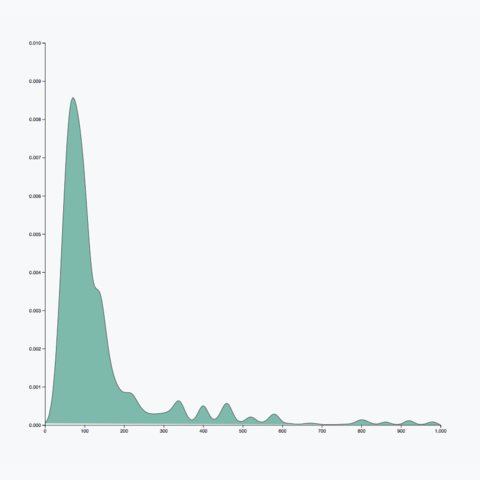
Playing with the bandwidth argument of your density plot
is a crucial step to avoid
over or under-smoothing. Thus, adding a slider that controls this value can be a great use
of interactivity. Of course, interactivity can also be used to filter
or change input dataset.
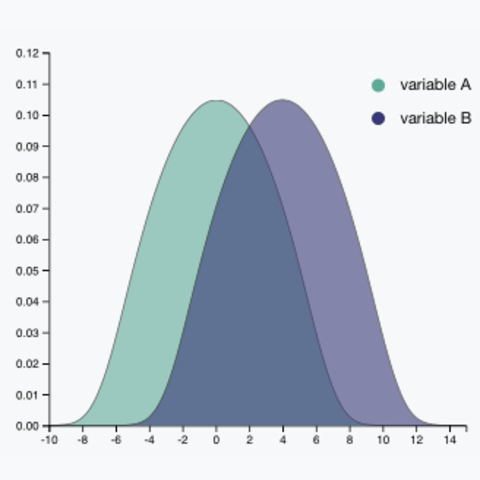
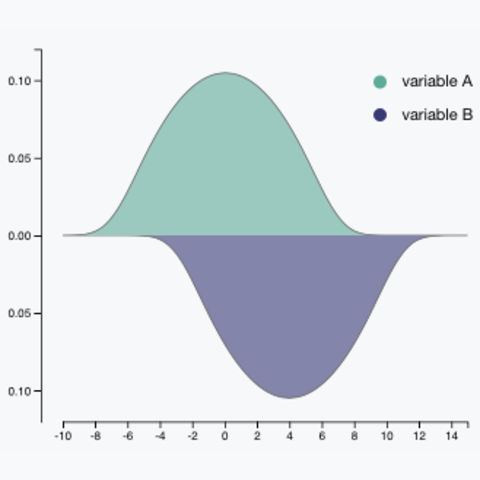
Selection of blocks
A selection of highly customized charts to see how to go further with density plots.