Density 2d


This is the density 2d section of the gallery. A 2d density represents the combined distribution of two quantitative variables. If you want to know more about this kind of chart, visit data-to-viz.com. If you're looking for a simple way to implement it in d3.js, pick an example below.

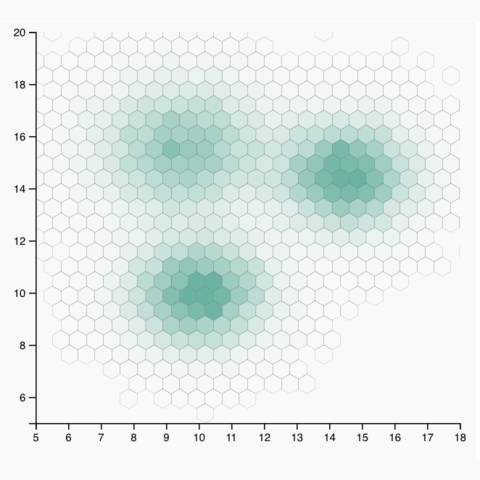
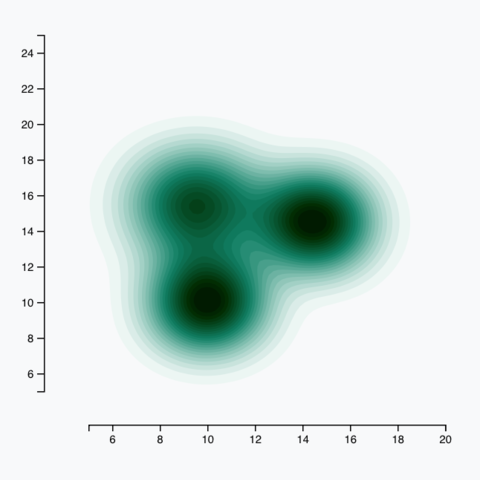
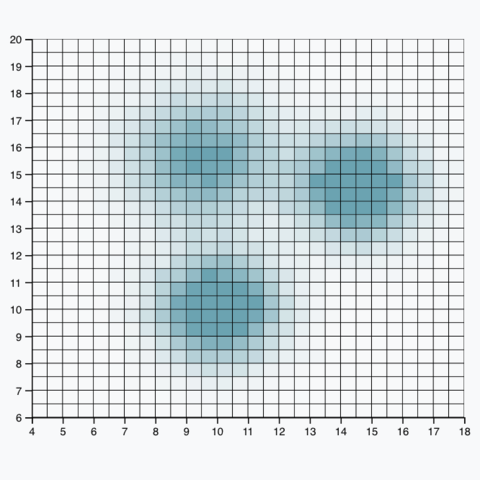
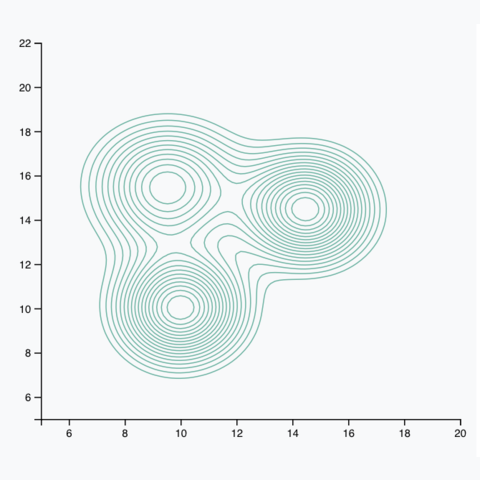
main density 2d types

A 2d density chart allows to visualize the combined distribution of two quantitative variables. The concept is always the same: one variable is represented on the X axis, the other on the Y axis. Then, the number of observations within a particular area of the 2D space is counted and represented by a color gradient.

Related chart types


Scatter
Heatmap
Correlogram
Bubble
Connected scatter
Density 2d