Step by step
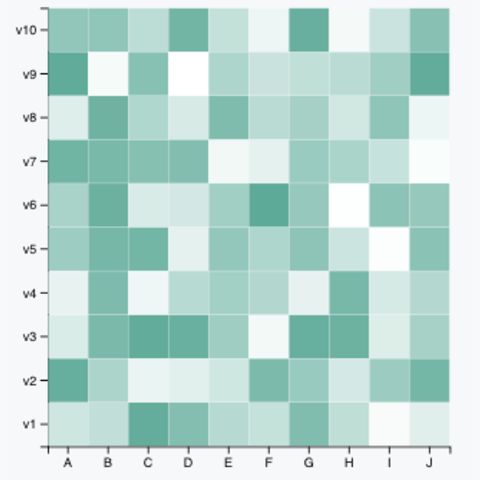
This is the heatmap section of the gallery. If you want to know more about this kind of chart, visit data-to-viz.com. If you're looking for a simple way to implement it in d3.js, pick an example below.
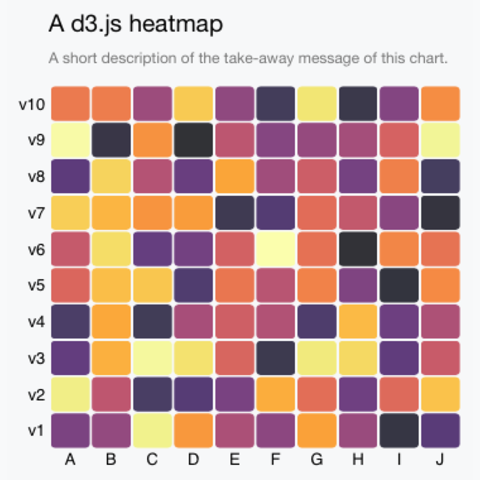
The following heatmap is my starting template for my personal work. It offers most of the feature you need for a good heatmap: colorBrewer colorscale, hover effect, tooltip, title and custom axis. The input dataset has 3 columns: row, column and value. Get the code here.
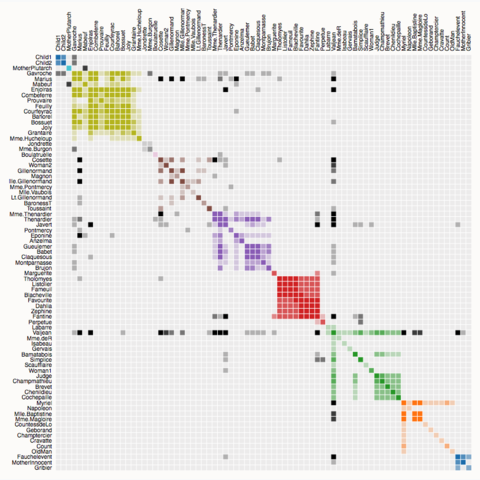
Related chart types