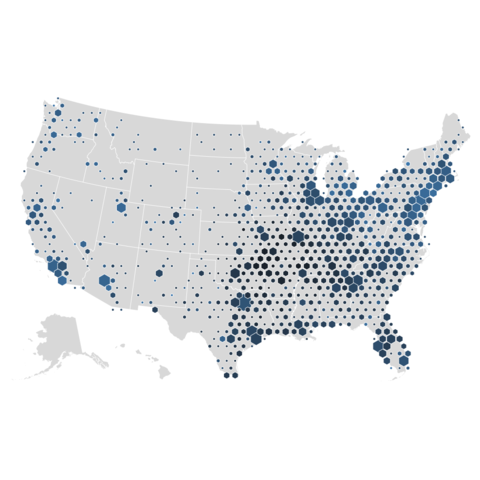
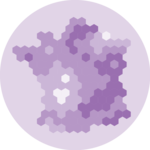
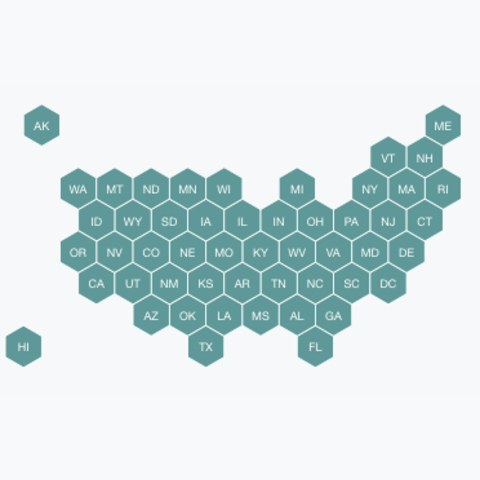
In this case, the technique is very close from a choropleth map. It's actually exactly the same, except that the geoJson input gives hexagon boundaries instead of region boundaries. Thus, you probably want to visit the choropleth section for more examples.
Choropleth section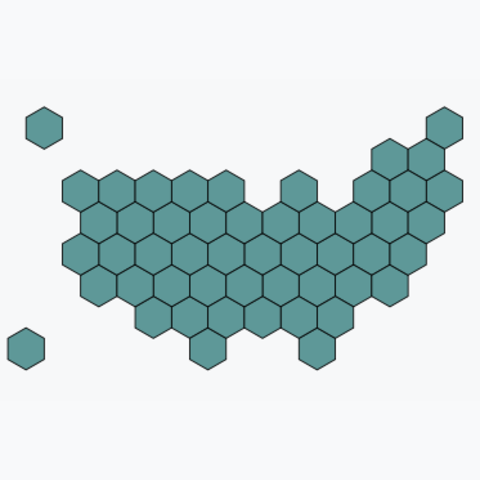
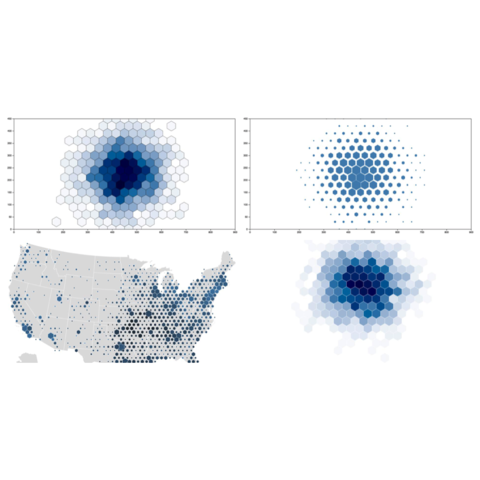
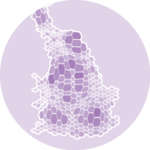
In this case, the required input is a list of coordinates. The map area will be split in a multitude of hexagon, the number of data point per hexagon will be counted and represented as a color. It is actually a density 2d technique plotted on top of a map.
Density 2d section
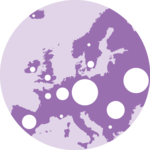
A few blocks with more complicated codes to showcase what's possible to do with connection maps. First show how to display connections on hover. Second show how to apply edge bundling to the connection to declutter the chart.