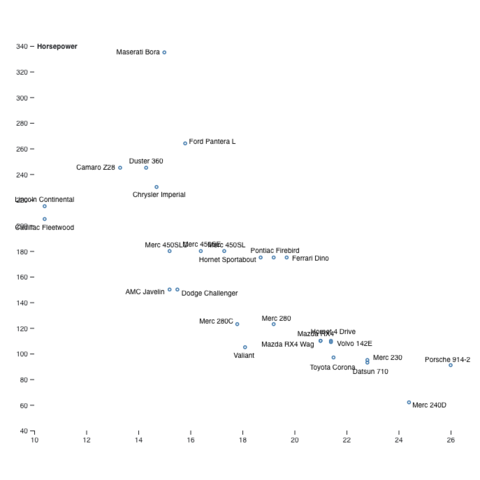
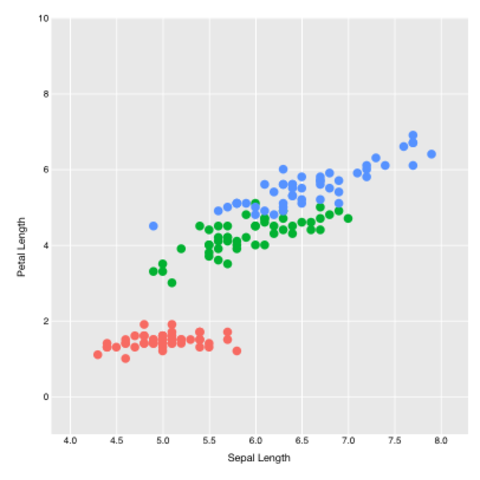
Scatterplot is one of the easiest chart to make with d3.js, and thus a good starting point if you're discovering this tool. The first example below is the most basic scatterplot you can do, keeping only the core code. Next is shown how to custom the general appearance, and how to add tooltips to each circle.
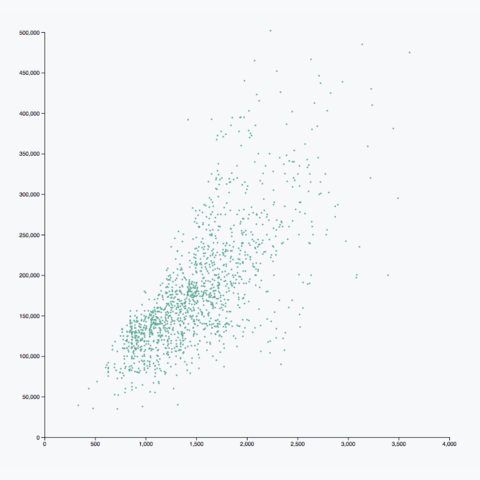
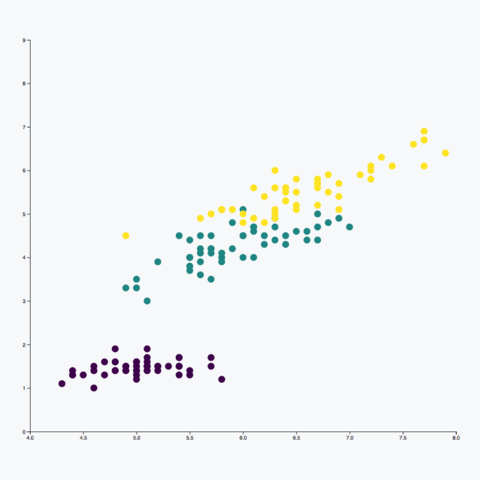
Grouping is a common practice in scatterplots. It allows to
investigate how groups behave for the 2 numeric variables. It requires
a
minimal additional amount of
effort: just create a color scale and use it for the
fill argument of the circles
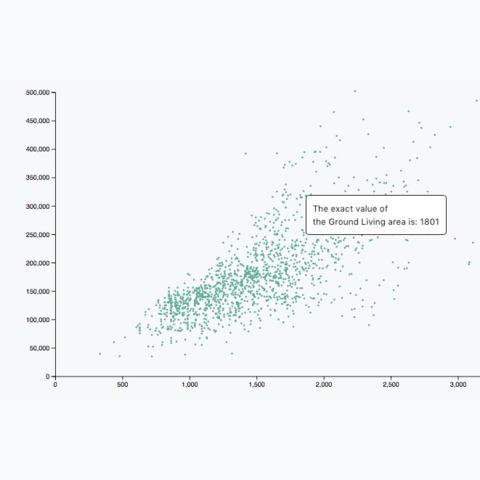
Two interactive features are highly necessary on scatterplots: the ability to zoom on a specific part of the chart, and the creation of tooltips linked to each data points. Here is a set of examples showing how to implement these features through different techniques.