The hardest part in stacked area chart creation is the use of the
d3.stack() function to stack the data. Once this step is
done, each group can be added thanks to the
d3.area() function. I strongly advise to understand how
to do a basic area chart before
trying the examples below.
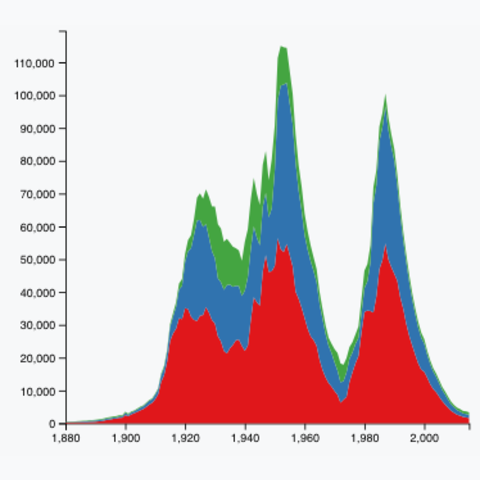

A stacked area chart showing the evolution of a few baby names in the US. Zoom on a specific time frame through brushing. Highlight a specific group by hovering the legend. Double click to unzoom.
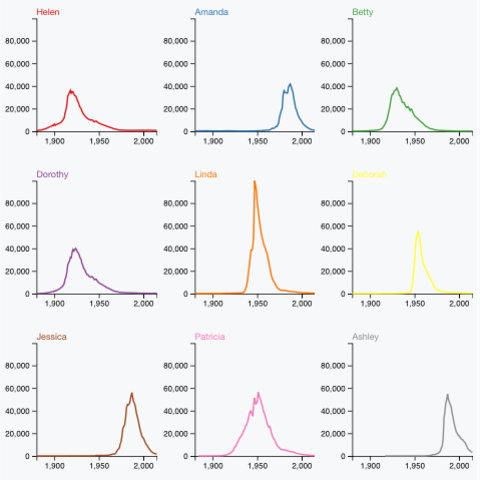
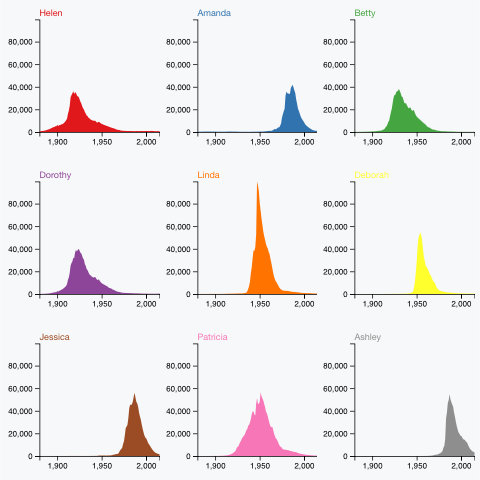
Code hereThe efficiency of stacked area graph is discussed and it must be used with care. They are great to study the evolution of the whole and the relative proportion of each group. However, they are not appropriate to study the evolution of each individual group. (Read more). Using small multiple is often a good alternative to highlight the evolution of each group.