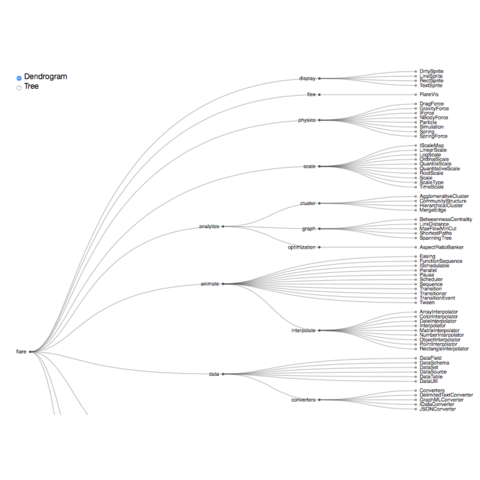
A note on input data format
Building dendrogram with d3.js requires to have an input
at the Json format, like
here. The
d3r package makes
it a breeze to get this format from a R data frame.
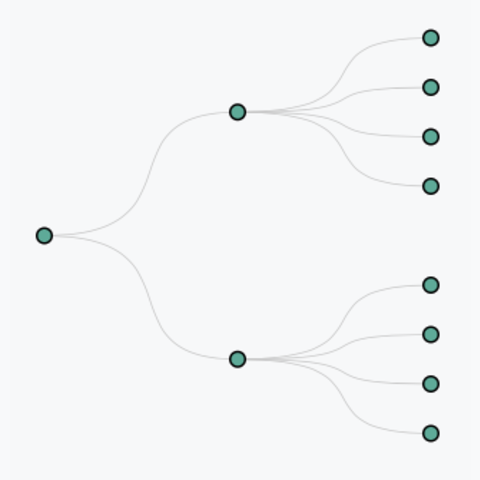
# This is R code

# create a simple hierarchy
data <- data.frame(
  level1="CEO",
  level2=c( rep("boss1",4), rep("boss2",4)),
  level3=paste0("mister_", letters[1:8])
)

# transform it to json format
library(d3r)
data_json <- d3_nest(data)

# Save in a json file
write(data_json, "data_ready.json")
You're now ready to use the file called
data_ready.json in your d3.js chart
Building a dendrogram with d3.js always follows the same steps.
First, a cluster layout must be defined with
d3.cluster(). Second, data is provided to this
layout thanks to d3.hierarchy(). We now have an object
with nodes coordinates. Lastly, we can use it to add nodes
with append('circle') and links with
append('path').
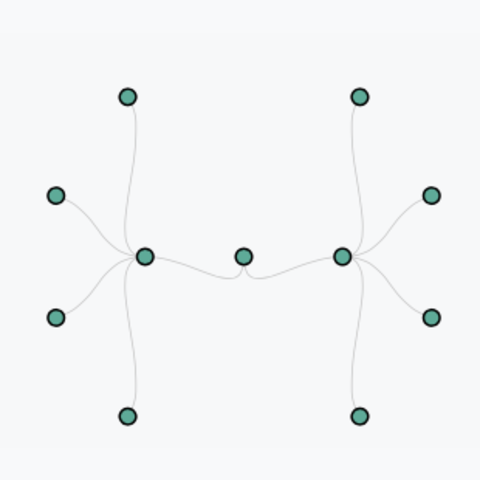
A few blocks with more complicated codes to showcase what's possible to do with hierarchical edge bundling.