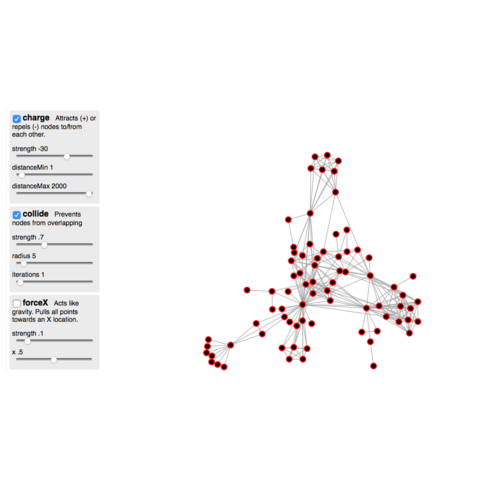
Network graph


This is the network graph section of the gallery. If you want to know more about this kind of chart, visit data-to-viz.com. If you're looking for a simple way to implement it in d3.js, pick an example below.

A note on input data format


Building a network chart requires information on nodes and links. This information can be stored in many different format as described here. Json format is the most convenient way to work with d3.js and looks basically like that:

{ "nodes": [
  { "id": 1, "name": "A" },
  { "id": 2, "name": "B" }
],
"links": [
  { "source": 1, "target": 2 }
]}

It is unlikely that your data are currently at this format. You probably need to reformat your data first using another tool like R. The following document gives a few example on how to reformat the most common types of input to get a json file.

Reformat your data to Json

A note about force


The challenge in network diagram is to find out smart X and Y coordinates for each node.

In d3, it is done using force and simulation. Different forces?

  • Centering (attracts every node to a specific position)
  • Collision (consider nodes as circles with radius and try to avoid overlapping)
  • Links (pushes linked nodes together, according to a link distance)
  • Many-Body (apply general attraction (if positive) or repulsion (if negative) between nodes)
  • Positioning (push each node towards a desired position).
Understand force parameters

This section is a work in progress. Please have a look to this resource for an introduction to force layout to build network charts with d3.js


Step by step


Interactivity

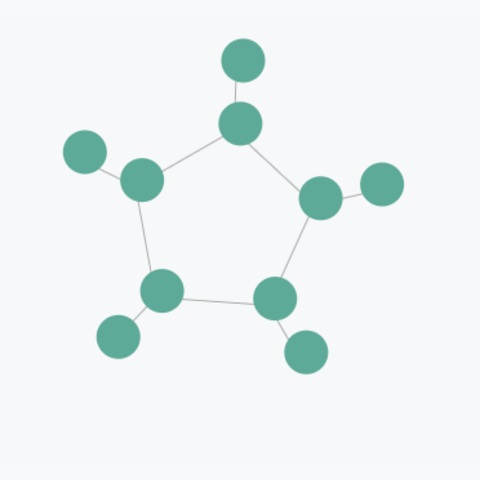
Interactivity can be used for several reasons. First of all, adding a tooltip to each node is very useful when many nodes are drawn and annotation is impossible. Then dragging. Then highlighting relationships of a node.


Template

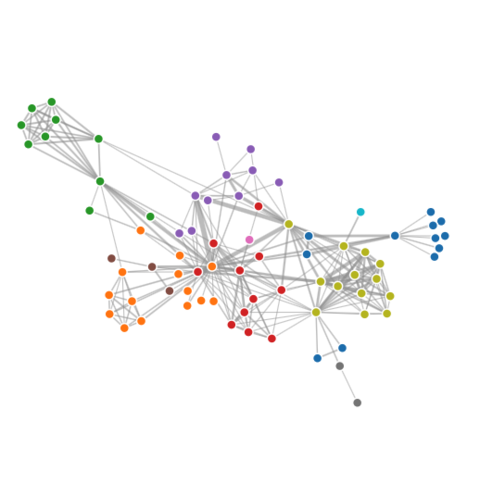
A template based on the co-authors network of a researcher.
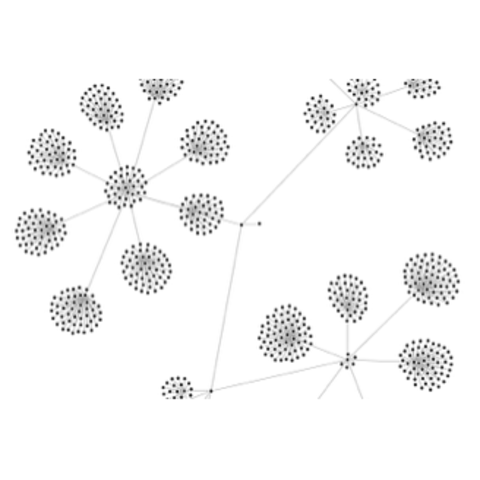


Selection of blocks

A selection of examples showing the application of the basic concept to real life dataset.

Related chart types


Chord diagram
Network
Sankey
Arc diagram
Edge bundling