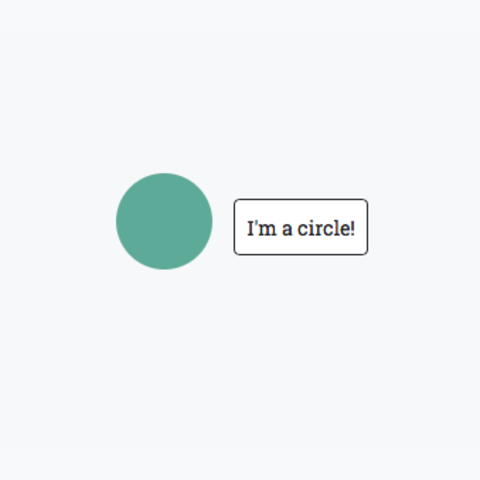
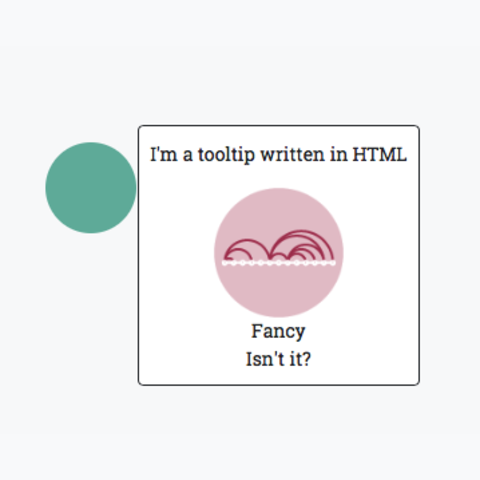
D3.js allows to easily add a tooltip to any element of your
chart. The idea is always the same: triggering a function when the
user mouseover, mousemove or
mouseleave the element. See the 3 examples below showing
how to apply this technique to a
single circle, how to
customize the
tooltip content, and
how to apply it to data.
A post on the basic of brushing with d3.js. It starts by very
basic use of the
d3.brush() function: just initializing the functionality.
Then, it explains how to
trigger a function
to perform a change on the selected points. Lastly, it describes how
to
smoothly zoom
on the selected area.

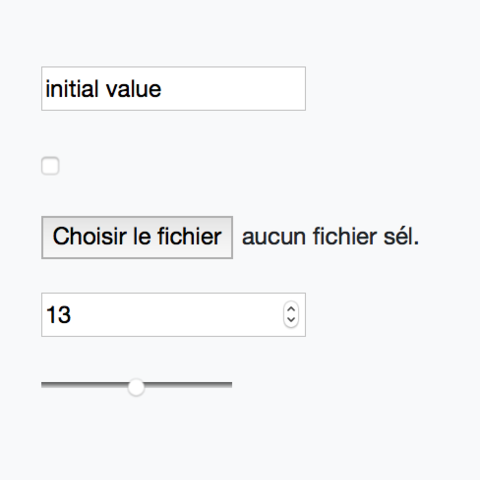
A post on buttons: what are the different types, how to add them using html, and how to connect them with the chart to trigger transition and animation.
A post on the basic of zooming with d3.js. It starts with a
very basic use of the
d3.zoom() function: just applied on a single circle.
Then, it explains how to
trigger a function
that update axis. Lastly, it shows that
brushing
can be used for zooming as well.
Transition is where the magic of D3 takes place. Here you will find a few examples based on a single element to understand the basic mechanism. A few examples based on a real chart are then available to illustrate the process.