Spider chart


A radar or spider or web chart is a two-dimensional chart type designed to plot one or more series of values over multiple quantitative variables. Each variable has its own axis, all axes are joined in the center of the figure. (data-to-viz.com). It has several downsides and should be used with care.

Step by step

Coming soon...


Existing Functions

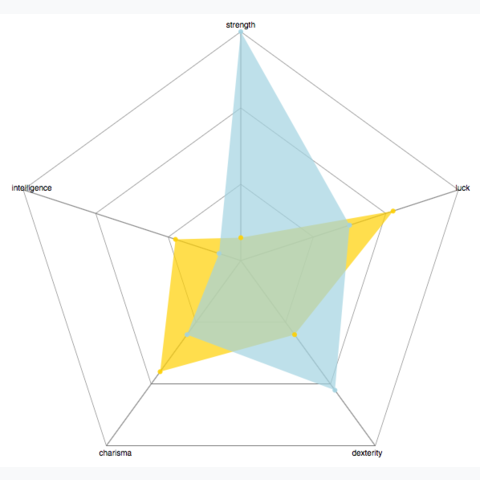
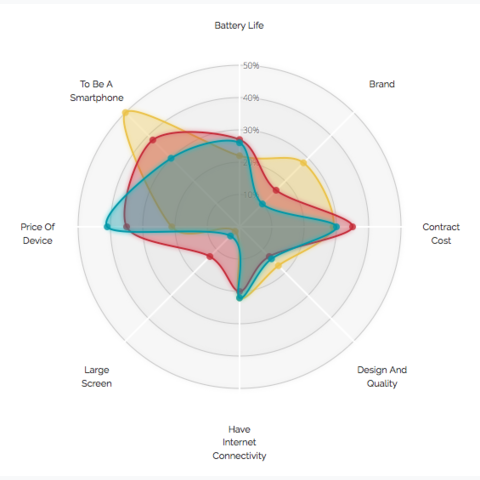
Spider charts can be tedious to implement in d3 due to the high number of elements composing them. Fortunately, open source functions are available on the web, making it easier and faster to build spider chart. Below are 2 examples using a function first coded by Alvaro Graves then revisited by Nadieh Bremer.

Related chart types


Barplot
Spider / Radar
Wordcloud
Parallel
Lollipop
Circular Barplot