Step by step
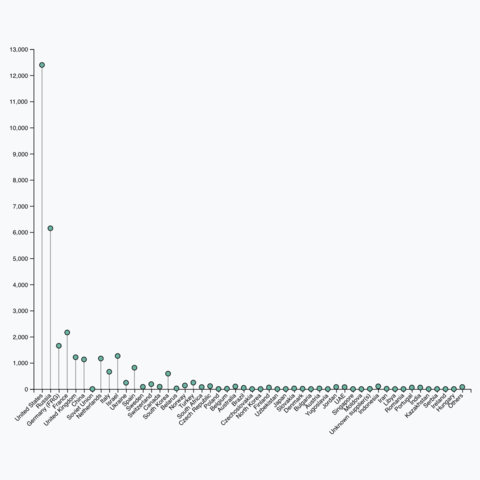
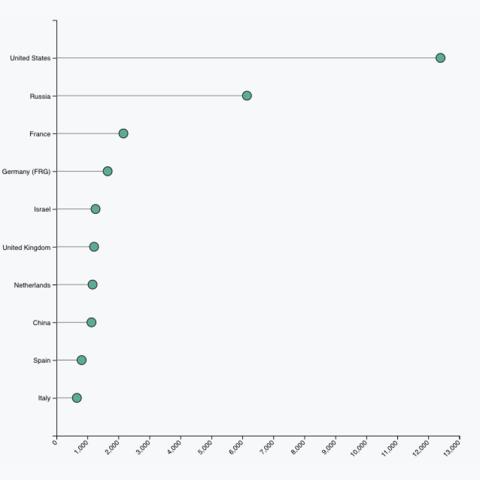
Building a lollipop chart follows almost the same process as for a
barplot. It is by the way used exactly for
the same kind of
input dataset. The idea is
to create a scalePoint() or a
scaleBand() and add a set a circle and another of
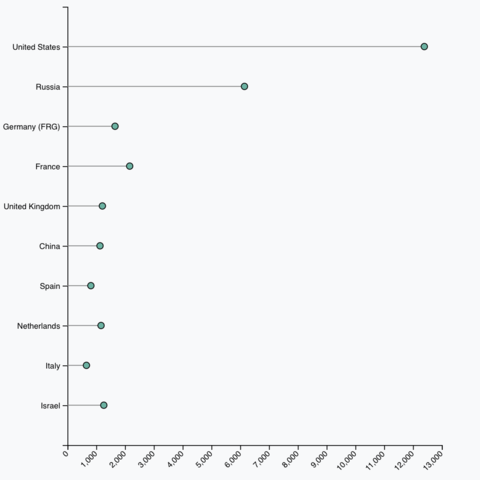
segments. Note that it often looks better
horizontal, and that
reordering is important.
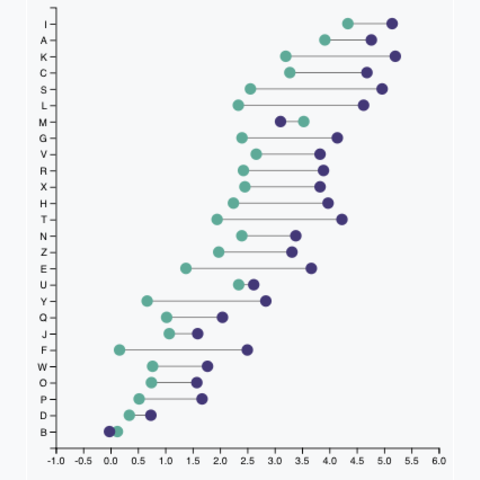
Animation
Interactivity is mainly going to be about buttons for lollipops. Here are a few examples. Note that the barplot section has many more interactive charts to offer, that can easily be converted to lollipops.