Creation of wordclouds in d3.js is made easy thanks to the d3-cloud plugin built by Jason Davies. A good way to explore the feature of this plugin is through this wordcloud generator. To learn how to use it with d3.js, read the examples below.

Wordclouds are useful for quickly perceiving the most prominent terms. They are widely used in media and well understood by the public. However, they are criticized for 2 main reasons:
- Area is a poor metaphor of a numeric value, it is hardly perceive by the human eye
- Longer words appear bigger by construction
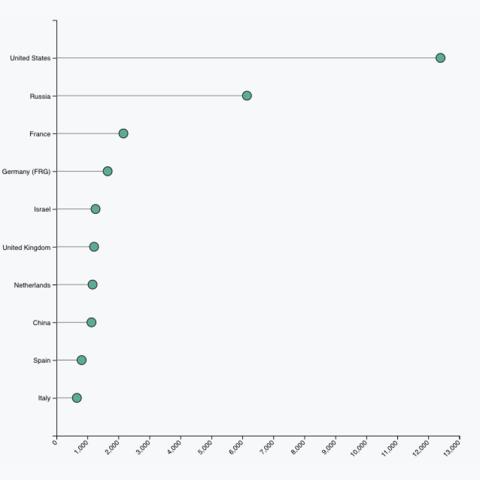
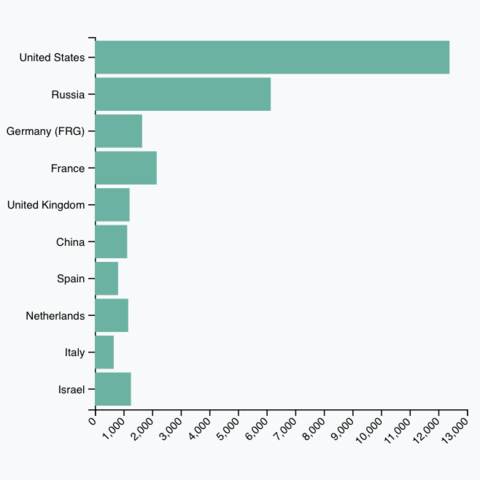
To put it in a nutshell, wordclouds must be avoided. You can read more about that in data-to-viz. Why not consider a lollipop plot or a barplot instead?
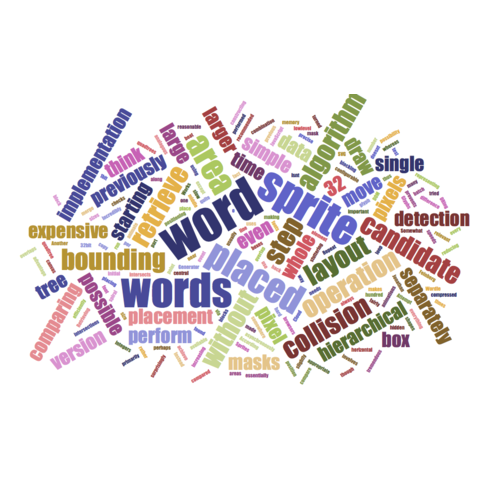
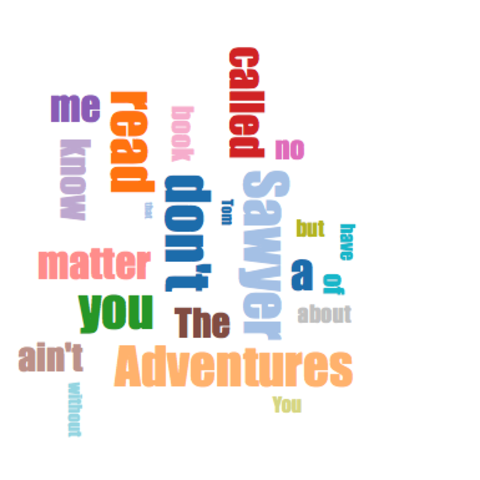
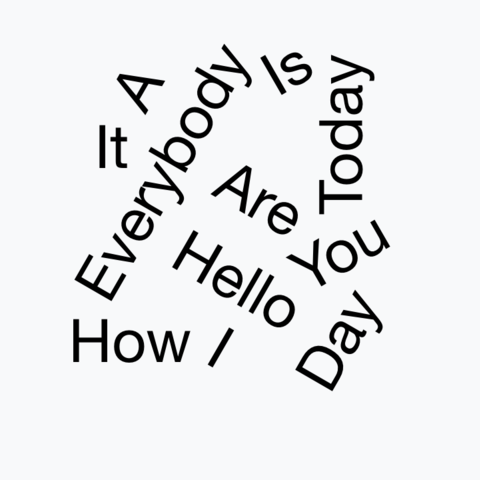
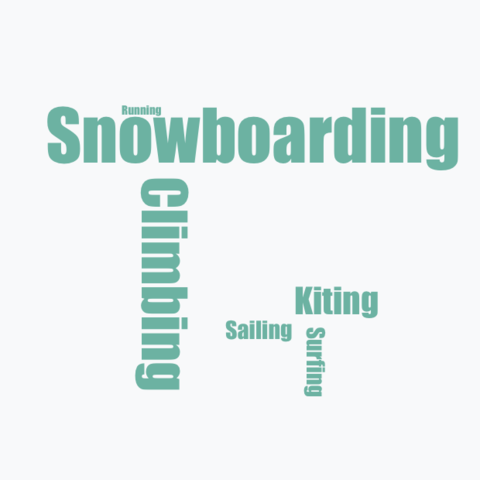
A few blocks highlighting the possibilities offered by the d3-cloud plugin