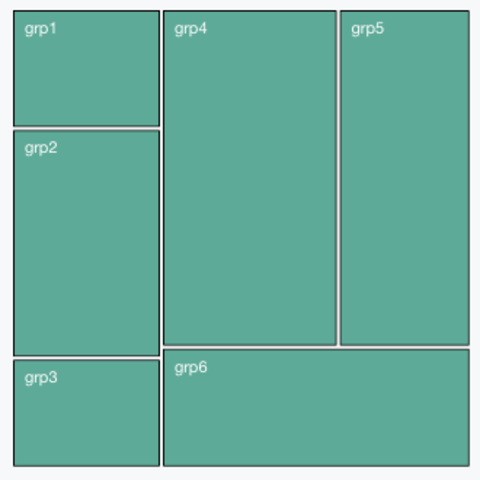
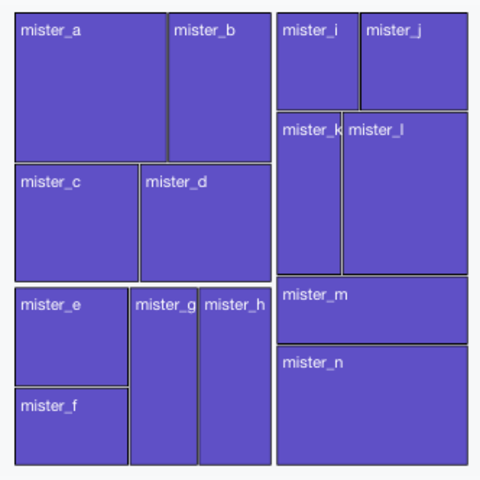
Step by step
It is important to note that 2 different input formats can be used to build a treemap:
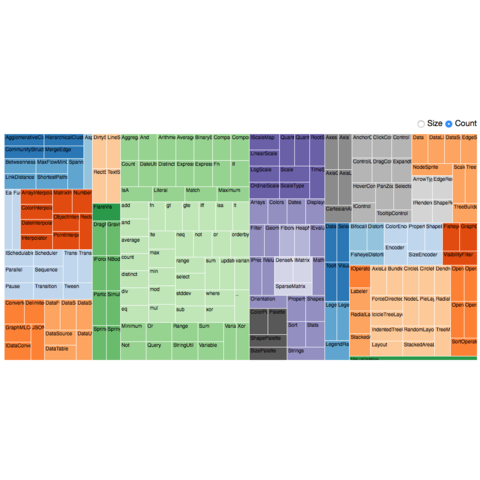
Interactivity
Two main reasons for using interactivity in treemaps. i/ Switching from one dataset to the other. ii/ building a zoomable treemap that allows to declutter the figure when several levels of hierarchy exist.
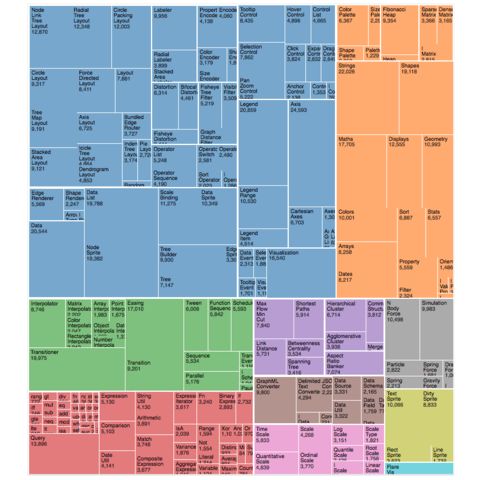
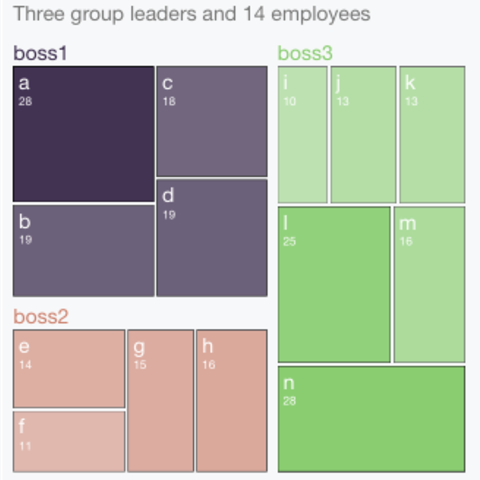
Selection of blocks
A few blocks with more complicated codes to showcase the possibility of d3 for treemaps